Should box office grosses be adjusted for inflation?
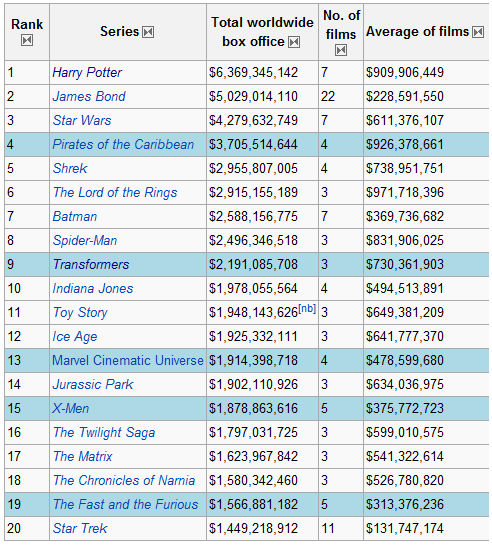
With the Harry Potter film franchise coming to an end this week there is a dispute about whether or not it is the most successful film series in history.
Wikipedia says it is:
But The Economist report that another British icon, James Bond, remains the box office champ:
But who is right?
It would seem to depend on which information you choose to include or accept.
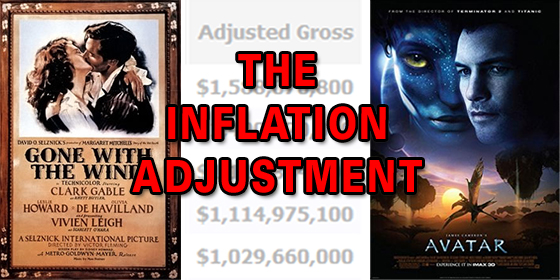
When people talk about the highest grossing films of all time, there is often a debate about whether or not Gone with the Wind (1939) is still the biggest film of all time.
When Avatar broke Titanic’s record Forbes published an article making this point.
Why?
It involves the magical words ‘adjusted for inflation‘, but how exactly is inflation adjusted?
Over at Box Office Mojo they describe their process:
Inflation-adjustment is mostly done by multiplying estimated admissions by the latest average ticket price. Where admissions are unavailable, adjustment is based on the average ticket price for when each movie was released (taking in to account re-releases where applicable).
Essentially what they are saying is that a simple bit of guesswork maths comes up with the following equation:
(estimated admissions x latest average ticket prices)
There is a certain logic to that, but what about the era before home entertainment really exploded in the 1980s?
Films such as Gone with the Wind were re-released at cinemas because there was no home entertainment ‘afterlife’.
Until the advent of television in the 1950s, VHS in the 1980s and DVD in 1990s films like this could only be seen in cinemas.
Box Office Mojo further describe how they account for this in their ‘adjusted for inflation’ box office chart:
* Indicates documented multiple theatrical releases. Most of the pre-1980 movies listed on this chart had multiple undocumentented releases over the years. The year shown is the first year of release. Most pre-1980 pictures achieved their totals through multiple releases, especially Disney animated features which made much of their totals in the past few decades belying their original release dates in terms of adjustment. For example, Snow White has made $118,328,683 of its unadjusted $184,925,486 total since 1983.
So Gone with the Wind and classic Disney movies hugely benefitted from re-releases over the years, simply because there was no home entertainment market.
Dig further and it gets even more complicated.
According to Box Office Mojo weekend box office data was primitive at best, even well in to the 1990s:
many movies from the 80s to mid-90s may not have as extensive weekend box office data and many movies prior to 1980 may not have weekend data at all, so the full timeframe for when that movie made its money may not be available. In such cases (and where actual number of tickets sold is not available), we can only adjust based on its total earnings and the average ticket price for the year it was released.
Still, this should be a good general guideline to gauge a movie’s popularity and compare it to other movies released in different years or decades. Since inflation adjusted sales figures are therefore not widely publicized by the film industry, inflation adjusted sales rankings and ticket sales comparisons across the last 100 years are difficult to compile.
So although we can get a rough idea of the popularity of a particular film, is it really so sensible to claim Gone with the Wind is a bigger film than Avatar based on a series of calculations?
If you go down the mathematical adjustment route, more things have to be factored in and that leads to even more questions.
What do changing ticket prices really say?
Whilst it is true that the cost of seeing Gone with the Wind in the 1930s was less than Avatar in 2009, there are other issues that come in to play.
The most obvious is the fundamental differences of two eras: films were released in a gradual way up until the 1970s and there were no computers or any of the data tracking tools studios now take for granted.
There is also the slippery nature of inflation itself: do the changes in ticket prices over several decades vary?
Inflation is used as a catch all term, but the rate of inflation may be different in 1950, 1970 and 2000 (is your head exploding yet?).
So, the equation which links ticket prices and inflation are on shifting sands.
Even if you compared the number of tickets sold, rather than the amount they sold for, you’ve got the additional problem of older machines and the retention of data from eras that weren’t using computers or keeping any detailed records.
(I would assume that grosses for films in the early 20th century were either reported in trade journals, newspapers or studio records)
What about the last decade? How do we measure the impact of 3D and IMAX prices, as you might argue that the grosses for Avatar and The Dark Knight were ‘artificially inflated’ by these newer formats which have in-built higher prices.
But what happens when you don’t adjust for inflation at all?
It would seem that over the last decade major movie studios have pushed this line, with wider releases on more screens so that they can use the term record-breaking as part of their marketing strategy.
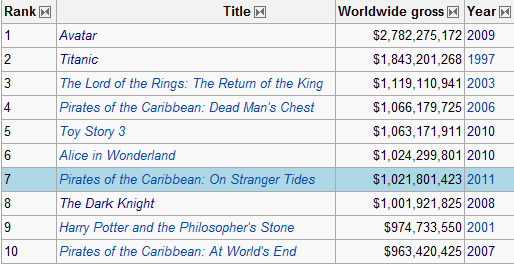
If you look at the current top 10 grossing films of all time on Wikipedia, the list is dominated by big franchises from the last decade.
The only exception is Titanic (1997) at number 2.
But what this list really reveals is that modern marketing and distribution systems are more advanced than ever before.
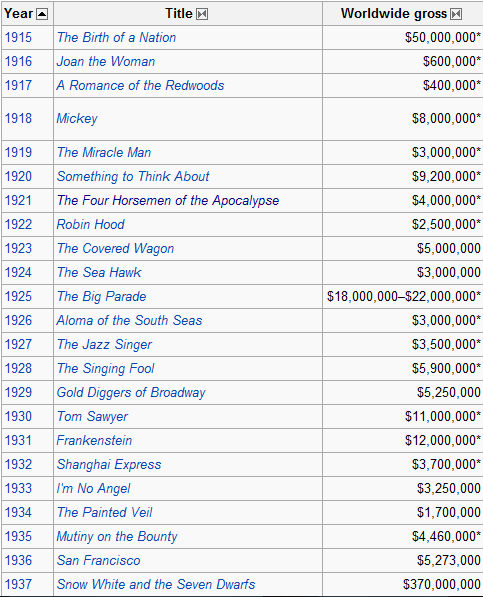
If you want a different perspective, consider the following films: The Birth of a Nation (1915), Gold Diggers of Broadway (1929), The Bachelor and the Bobby-Soxer (1947), Rear Window (1954), 2001: A Space Odyssey (1968), The Godfather (1972) and Blazing Saddles (1974).
What do they have in common?
The answer is that they were the most successful films of their respective years, which Wikipedia have usefully listed under another list of the highest-grossing films by year:
After Jaws (1975) and Star Wars (1977) the list is mostly filled by action or fantasy tent-pole releases, with the 2000s being dominated by pirates, wizards and hobbits.
Wikipedia explains the normalizing of data to individual years:
Normalizing this to the reference year normalizes all social, economical, and political factors such as the availability of expendable cash, number of theater screens, relative cost of tickets, competition from television, the rapid releases of movies on DVDs, the improvement of home theater equipment, and film bootlegging.
For example, in 1946 the per capita movie ticket purchasing rate for the average person was 34 tickets a year. In 2004, this average rate had dropped to only five tickets per person per year, in response mainly to competition from television.
There is a lot to be said for this approach as captures what films meant in a particular social and historical context.
I think it also brings us back to the central question of whether or not we should even attempt to adjust for inflation.
The modern day film industry is structured around newly released films, so they have a vested interest in not doing it.
After all 20th Century Fox don’t exactly want to promote Avatar on billboards as:
“The biggest film of all time – apart from Gone with the Wind!”
At the same time, there is some value in trying to account for different eras and the impact particular films had.
Theatrical box office can sometimes be a little misleading.
The Shawshank Redemption (1994) initially failed at the box office, but was the most rented film on video in 1995 and now regularly tops the IMDb 250 (it is currently ahead of its perennial rival The Godfather).
The Bourne Identity (2002) was a decent hit at the box office, but went on to become the most rented film in America on VHS and DVD in 2003, thus paving the way for the greater success of the following sequels.
These are exceptions but show what impact word of mouth can have in an era of home entertainment.
Perhaps a more useful way of measuring the box office over time is a combination of considering what films made the most money in the current era, along with checking what was successful in a particular year.
It isn’t perfect but shows the complications that can lie under what seems to be simple facts.
> Box Office Mojo’s list of the highest grossing films of all time (adjusted for inflation)
> Wikipedia’s list of the highest grossing films of all time
> Forbes article from 2010 on Avatar vs Gone with the Wind
