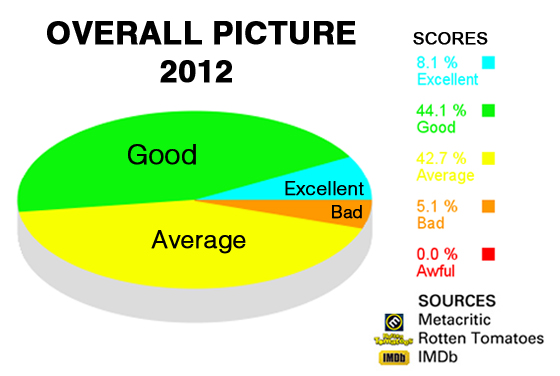
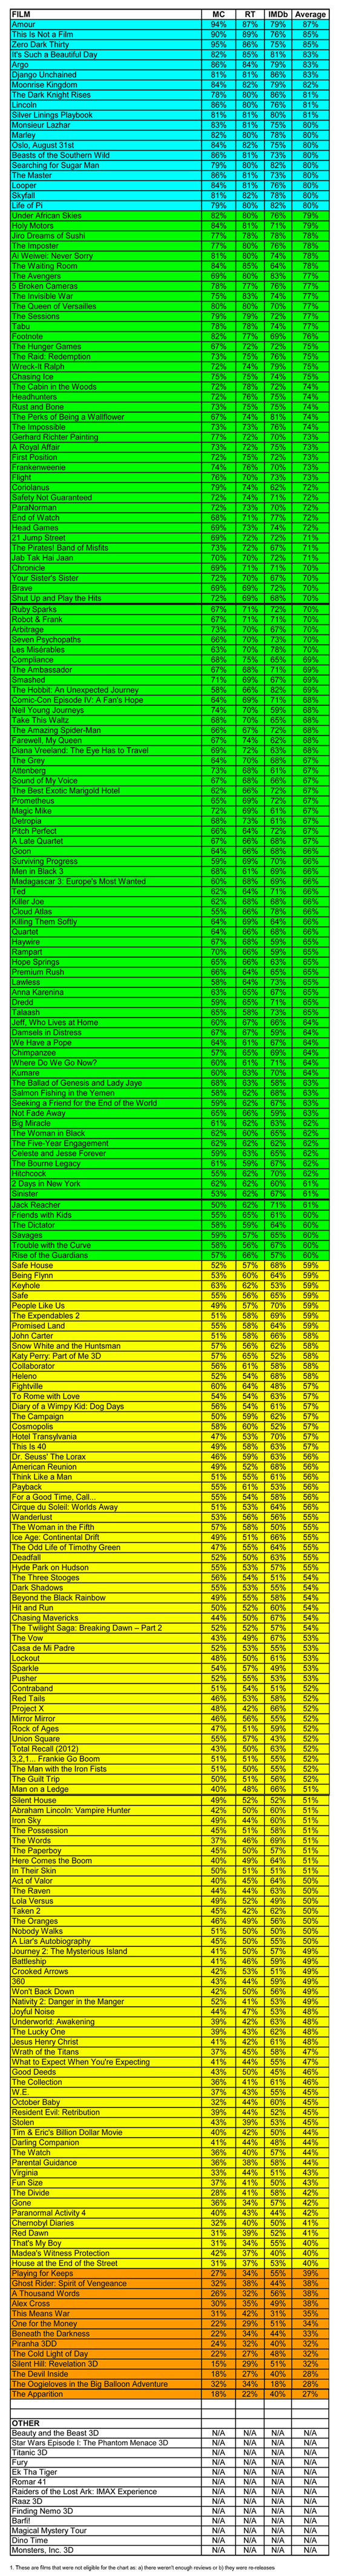
Using roughly the same methods this time around, the goal was to get a similar picture for a whole year.
Data from the aforementioned websites was analysed again using all the US releases listed on the Wikipedia entry for 2012. (To do global releases would have been a logistical nightmare).
There were a few films we didn’t include, such as 3D re-releases like Titanic and Finding Nemo, along with some that didn’t appear on all three of the review hubs.
We added the Metacritic, Rotten Tomatoes (for the latter we used the average % score) and IMDb user rating, which was then divided by three to get a final score.
The five bands which corresponded to each score were: Excellent (100-80), Good (80-60), Average (60-40), Bad (40-20) and Awful (20-0).
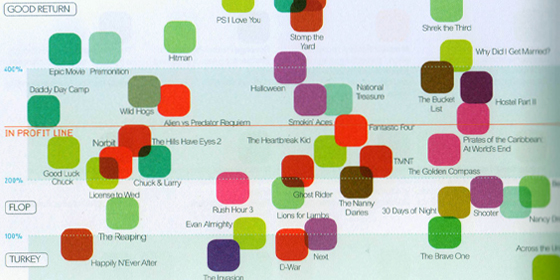
It always bugs me how Hollywood grades or broadcasts the success of a film by gross income. Profitability, or % of Budget Recovered, is a way better grade of a film’s success. Especially in America, where each film has such high printing and advertising costs, that it needs to recover about 250-300% of its budget to be deemed a true hit. In fact, if you use Profitability as an index, it changes the view considerably. Take 2007, for example, where the biggest grossing film was Pirates Of The Caribbean: At Worlds End. But it only recovered 320% of its budget.
He gave a TED talk in June 2010 explaining his approach to visualising data:
But lets take a look at the basic figures he has assembled so far.
For the full spreadsheet click here (there’s a lot of data to chew on) but for convenience I’ve listed the ten most profitable films from 2007-2011 according to his criteria.
Just to clarify these figures are ‘market profitablilty’ scores based on the percentage of the budget recovered.
N.B. Films marked independent may have been distributed by a major company but were financed independently.
There’s some brief points to consider:
Note the last gasp of the old indie era in 2007 before the financial crash of 2008.
The Dark Knight was both the highest grossing and most profitable film of 2008.
Paranormal Activity was insanely profitable and triggered a boom in low-budget horror.
2010 is a very interesting mix of low budget and studio films.
What the hell is Never Back Down 2: The Beatdown?
2007
Juno (Independent) 3082%
Saw IV (Independent) 1394%
Waitress (Independent) 1109%
Superbad (Sony) 849%
The Simpsons Movie (Fox) 703%
300 (Warner Bros.) 702%
The Game Plan (Disney) 672%
Knocked Up (Universal) 664%
No Country for Old Men (Paramount) 644%
Harry Potter and the Order of the Phoenix (Warner Bros.) 627%
2008
The Dark Knight (Warner Bros.) 83%
Tyler Perry’s The Family That Preys (Independent) 74%
Fireproof (Independent) 67%
Iron Man (Marvel) 53%
Step Brothers (Sony) 49%
Wanted (Universal) 49%
Marley and Me (Fox) 45%
Vantage Point (Sony) 43%
Indiana Jones and the Kingdom of the Crystal Skull (Paramount) 31%
High School Musical 3: Senior Year (Disney) 22%
2009
Paranormal Activity (Independent) 11, 420%
The Twilight Saga: New Moon (Summit) 14%
The Hangover (Warner Bros.) 13%
Avatar (Fox) 11%
The Blind Side (Independent) 10%
Ice Age: Dawn of the Dinosaurs (Fox) 9.8%
Taken (EuropaCorp) 9.1%
The Proposal (Disney) 7.9%
(500) Days of Summer (Fox) 7.8%
He’s Just Not That Into You (Warner Bros.) 7.1%
2010
Paranormal Activity 2 (Independent) 5917%
The Last Exorcism (Independent) 3692%
Black Swan (Fox) 2531%
The King’s Speech (Independent) 1635%
The Twilight Saga: Eclipse (Summit) 1020%
Easy A (Sony) 921%
Buried (Independent) 919%
The Karate Kid (Sony) 898%
Jackass 3-D (Paramount) 850%
Despicable Me (Universal) 785%
2011
Insidious (Independent) 6467%
Paranormal Activity 3 (Paramount) 4038%
Never Back Down 2: The Beatdown (Sony) 1388%
Bad Teacher (Sony) 1081%
Harry Potter and the Deathly Hallows Part 2 (Warner Bros) 1062%
Bridesmaids (Relativity Media) 887%
Midnight in Paris (Independent) 819%
The Help (DreamWorks) 797%
The Hangover Part II (Warner Bros.) 727%
Another Earth (Independent) 661%
I’m pretty sure The Inbetweeners Movie should be in this year but that may have had something to do with its US release.
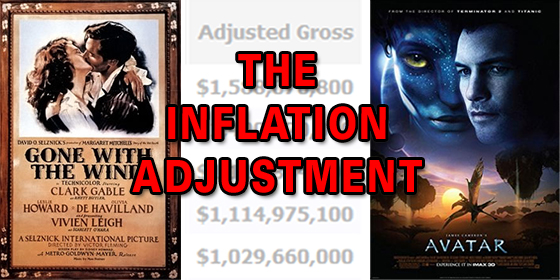
Should box office grosses be adjusted for inflation?
With the Harry Potter film franchise coming to an end this week there is a dispute about whether or not it is the most successful film series in history.
But The Economist report that another British icon, James Bond, remains the box office champ:
But who is right?
It would seem to depend on which information you choose to include or accept.
When people talk about the highest grossing films of all time, there is often a debate about whether or not Gone with the Wind (1939) is still the biggest film of all time.
Inflation-adjustment is mostly done by multiplying estimated admissions by the latest average ticket price. Where admissions are unavailable, adjustment is based on the average ticket price for when each movie was released (taking in to account re-releases where applicable).
Essentially what they are saying is that a simple bit of guesswork maths comes up with the following equation:
(estimated admissions x latest average ticket prices)
There is a certain logic to that, but what about the era before home entertainment really exploded in the 1980s?
Films such as Gone with the Wind were re-released at cinemas because there was no home entertainment ‘afterlife’.
Until the advent of television in the 1950s, VHS in the 1980s and DVD in 1990s films like this could only be seen in cinemas.
Box Office Mojo further describe how they account for this in their ‘adjusted for inflation’ box office chart:
* Indicates documented multiple theatrical releases. Most of the pre-1980 movies listed on this chart had multiple undocumentented releases over the years. The year shown is the first year of release. Most pre-1980 pictures achieved their totals through multiple releases, especially Disney animated features which made much of their totals in the past few decades belying their original release dates in terms of adjustment. For example, Snow White has made $118,328,683 of its unadjusted $184,925,486 total since 1983.
So Gone with the Wind and classic Disney movies hugely benefitted from re-releases over the years, simply because there was no home entertainment market.
Dig further and it gets even more complicated.
According to Box Office Mojo weekend box office data was primitive at best, even well in to the 1990s:
many movies from the 80s to mid-90s may not have as extensive weekend box office data and many movies prior to 1980 may not have weekend data at all, so the full timeframe for when that movie made its money may not be available. In such cases (and where actual number of tickets sold is not available), we can only adjust based on its total earnings and the average ticket price for the year it was released.
Still, this should be a good general guideline to gauge a movie’s popularity and compare it to other movies released in different years or decades. Since inflation adjusted sales figures are therefore not widely publicized by the film industry, inflation adjusted sales rankings and ticket sales comparisons across the last 100 years are difficult to compile.
So although we can get a rough idea of the popularity of a particular film, is it really so sensible to claim Gone with the Wind is a bigger film than Avatar based on a series of calculations?
If you go down the mathematical adjustment route, more things have to be factored in and that leads to even more questions.
What do changing ticket prices really say?
Whilst it is true that the cost of seeing Gone with the Wind in the 1930s was less than Avatar in 2009, there are other issues that come in to play.
The most obvious is the fundamental differences of two eras: films were released in a gradual way up until the 1970s and there were no computers or any of the data tracking tools studios now take for granted.
There is also the slippery nature of inflation itself: do the changes in ticket prices over several decades vary?
Inflation is used as a catch all term, but the rate of inflation may be different in 1950, 1970 and 2000 (is your head exploding yet?).
So, the equation which links ticket prices and inflation are on shifting sands.
Even if you compared the number of tickets sold, rather than the amount they sold for, you’ve got the additional problem of older machines and the retention of data from eras that weren’t using computers or keeping any detailed records.
(I would assume that grosses for films in the early 20th century were either reported in trade journals, newspapers or studio records)
What about the last decade? How do we measure the impact of 3D and IMAX prices, as you might argue that the grosses for Avatar and The Dark Knight were ‘artificially inflated’ by these newer formats which have in-built higher prices.
But what happens when you don’t adjust for inflation at all?
It would seem that over the last decade major movie studios have pushed this line, with wider releases on more screens so that they can use the term record-breaking as part of their marketing strategy.
But what this list really reveals is that modern marketing and distribution systems are more advanced than ever before.
If you want a different perspective, consider the following films: The Birth of a Nation (1915), Gold Diggers of Broadway (1929), The Bachelor and the Bobby-Soxer (1947), Rear Window (1954), 2001: A Space Odyssey (1968), The Godfather (1972) and Blazing Saddles (1974).
What do they have in common?
The answer is that they were the most successful films of their respective years, which Wikipedia have usefully listed under another list of the highest-grossing films by year:
After Jaws (1975) and Star Wars (1977) the list is mostly filled by action or fantasy tent-pole releases, with the 2000s being dominated by pirates, wizards and hobbits.
Normalizing this to the reference year normalizes all social, economical, and political factors such as the availability of expendable cash, number of theater screens, relative cost of tickets, competition from television, the rapid releases of movies on DVDs, the improvement of home theater equipment, and film bootlegging.
For example, in 1946 the per capita movie ticket purchasing rate for the average person was 34 tickets a year. In 2004, this average rate had dropped to only five tickets per person per year, in response mainly to competition from television.
There is a lot to be said for this approach as captures what films meant in a particular social and historical context.
I think it also brings us back to the central question of whether or not we should even attempt to adjust for inflation.
The modern day film industry is structured around newly released films, so they have a vested interest in not doing it.
After all 20th Century Fox don’t exactly want to promote Avatar on billboards as:
“The biggest film of all time – apart from Gone with the Wind!”
At the same time, there is some value in trying to account for different eras and the impact particular films had.
Theatrical box office can sometimes be a little misleading.
These are exceptions but show what impact word of mouth can have in an era of home entertainment.
Perhaps a more useful way of measuring the box office over time is a combination of considering what films made the most money in the current era, along with checking what was successful in a particular year.
It isn’t perfect but shows the complications that can lie under what seems to be simple facts.
Black Swan is set to become the top domestic film in 2010 for parent studio 20th Century Fox.
It has currently made $97m in the US and already has a combined worldwide gross of $145m.
This is fairly staggering when you consider that Darren Aronofsky’s film is a product of their specialty division Fox Searchlight and not the major studio.
In addition the film was not an easy sell, as executives feel safer green-lighting sequels and remakes rather than psychological thrillers set in the world of ballet.
Fox struggled in 2010 with a series of underperforming films, only offset by the phenomenon of Avatar which grossed 408m in the US.
In addition the Christmas releases for the studio were the relative disappointments of Gulliver’s Travels ($181m gross on a budget of $112m) and Love and Other Drugs ($90m gross on a $30m budget).
Black Swan was made for a mere $13 million, with Cross Creek Pictures and Fox Searchlight splitting the costs after a previous round of financing fell apart. (To put the budgets into perspective, Black Swan cost just one eighth of what the Narnia sequel did).
After its world premiere at the Venice film festival, it played to acclaim and buzz on the festival circuit and a canny platform release in December has seen it rewarded with big audiences and five Oscar nominations.
But what accounts for the remarkable success of the film?
“I think the largest factor in the film’s success is originality. People love to go to the movies and see something they can’t put in a little box”.
One of the film’s producers Brian Oliver offers his take:
“I think the whole year of independent film in the best picture category is showing that you can make commercial artsy films at a budget that can perform at studio levels. I’m more surprised that it’s going to hit the $100 million domestic mark than by what it’s doing overseas.”
According to surveys the film has been especially popular with young women under-25, an audience usually starved on bad romantic comedies starring Katherine Heigl or Kate Hudson.
But does the daring and trippy nature of the film suggest that studios will be willing to take chances on more unusual projects?
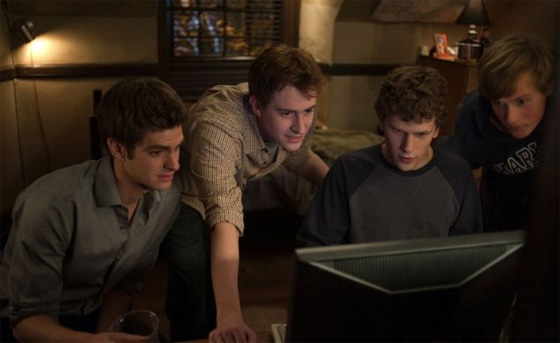
The Social Network topped the US box office this weekend, grossing an estimated $23 million on around 3,800 screens at 2,771 locations.
Over the last week, the big question was whether the subject matter (the founding and conflicts over Facebook) could appeal to older males and females.
Exit polls indicated 53% of the audience was female and 55% were over 25.
With great reviews and a lot of media buzz, this was a decent opening but perhaps a more interesting indicator will be how it holds next week.
There had been expectations that it would hit the Number 1 slot and could have a $30 million opening, but it failed to hit the top slot which was instead claimed by the DreamWorks animated film How To Train Your Dragon, which is in its fourth week of release.
* UPDATE 19/04/10: Variety are now reporting that Kick-Ass was the Number 1 film of the weekend as Lionsgate opened it early on Thursday and are counting those grosses in with their final figure. This allows them to claim the weekend, although the figures are so narrow I still think the studio are going to be disappointed with this opening. *
It is worth pointing out that Kick-Ass was an interesting case study as it was funded outside the studio system and was a rare example of a high profile indie film having a shot at making some decent cash.
Things looked promising as it was being released by Lionsgate (the only major distributor outside of the big six major studios) and they have a strong track record in releasing edgier films – like the Saw franchise – to a wide audience.
Kick-Ass seemed to be tailor made for them: it looked like a superhero movie; it had lots of carefully cultivated buzz on the geekier websites (AICN, CHUD); and it was a film that directly appealed to a hipper, younger audience.
This meant that Lionsgate felt they had a potential breakthrough hit on their hands and they spent heavily marketing the film. Some have speculated they acquired it for $25m and $40m on prints and advertising, including TV ads like this.
Going in to the weekend it had decent reviews (76 on Rotten Tomatoes, 67 on Metacritic), online buzz, awareness and it was on a load of screens with little in the way of serious rivals (the main one being the US remake of Death of a Funeral).
By the end of the weekend it had only grossed $19.7m and had been (narrowly) beaten to the top slot by an animated film that had already been out for three weeks.
Why did it under perform?
My guess is that it played well to the male-skewing fanbase but just didn’t connect with the wider audience due to the violence, the in-your-face tone of the film and the fact that it was not a conventional super-hero movie at all.
Distributor Lionsgate’s exit polling indicated that 60 percent of those who saw Kick-Ass audience were male and 50 percent was under 25 years old.
In essence, the geeks raved and went to see it but the wider audience didn’t.
Given that the accepted formula for a film’s theatrical gross is to multiply the opening weekend figures by 2.5, this would suggest Kick-Ass is only going to gross around $65m.
This might seem a respectable number for an independent production but in order to greenlight a sequel and build a franchise, they’d be looking for a higher number.
Although the film had created levels of hysteria amongst fanboys not seen since Watchmen, it is a salutary reminder that creating a genuine mainstream hit outside the studio system remains difficult.
With weekend figures for his latest film adding up to a staggering $1.838 billion worldwide, this weekend’s expected $15 million US earnings allowed it to do what many thought was unthinkable and surpass his 1997 epic, which had a worldwide gross of $1.842 billion.
‘Titanic’ still remains the highest grosser domestically in the US with $600.8 million, but it only seems like a matter of time before Cameron’s latest film catches up after already earning $551.7 million as of Monday.
It is a remarkable achievement, as Titanic seemed a one off that would never be repeated, but the combination of multiple repeat viewings and the higher ticket prices for 3D screenings helped turn it into a tsunami of cash for 20th Century Fox.
Part of the key to its mainstream success lies in the fact that this is the first live action 3D film for a mass mainstream audience. Although 3D has become the norm at cinemas for animated films over the last 18 months, live action films such as The Final Destination were gimmicky and few and far between.
But Avatar was designed from the beginning as a spectacular and immersive 3D experience which would be shown on as many new digital screens as possible.
It was a calculated gamble for Fox and Cameron to push this technology on such a high profile film, which wasn’t an established property or sequel, but it has paid off handsomely.
Another aspect worth noting is how well it has done in markets such as China and Russia, which were harder to tap back in the late 1990s and this certainly helped its global box office numbers.
Why has it hit such a chord with audiences?
The combination of ground breaking visuals and a universal story line that fits neatly into many global cultures would appear to be the primary reasons but we should also bear in mind the Christmas box office, which features less competition than the summer.
Can it break the $2 billion barrier? At this point few would bet against it.
Last year there were 173.9m customers, who collectively bought £944m worth of tickets with the most successful films being:
Harry Potter and the Half-Blood Prince – £50.72m
Avatar – £41.00m
Ice Age III – £35.02m
Up – £34.42m
Slumdog Millionaire – £31.66m
The Twilight Saga: New Moon – £27.08m
Transformers: Revenge Of The Fallen – £27.06m
The Hangover – £22.12m
Star Trek – £21.40m
Monsters Vs. Aliens – £21.37m [Source: Nielsen EDI, UK Film Council]
Ticket sales have varied in the past seven years, peaking in 2002 with a total of 175.9m admissions and dipping to 156.6m in 2006.
The World Cup was a factor for both of these years, as televised games in the summer always eat into the summer box office.
But the very early kick off times in the 2002 tournament (when the tournament was in Korea and Japan) didn’t have the same effect as in 2006 when a lot of games in Germany were in the same time zone.
However, the big trend for last year was the surge in ticket sales which was helped in part by three films: Harry Potter and the Half-Blood Prince, Twilight: New Moon and Avatar.
Potter is the most bankable film franchise in history, New Moon has brought younger female audiences out in droves and Avatar is essentially the new Titanic.
It is also worth looking at how successful family friendly animated films are: Up, Monsters vs Aliens and Ice Age III have all done major business. The international grosses of the latter are truly mind boggling given how relatively cheap it was to make.
I don’t always subscribe to the notion that cinema does well in a recession but if the right mix of films hit the spot for mass audiences across the board then it is cheaper than other leisure activities and an escape from going down the pub and discussing how miserable life is.
It remains doubtful that 2010 will be as successful as 2009 and I imagine Avatar will cast a long shadow over fellow box office rivals.
But summer releases that look set to do serious business include Iron Man 2, Sex and the City 2 (God help us), Robin Hood, Toy Story 3, Twilight: Eclipse and Harry Potter and the Deathly Hallows Part 1 in November.
The movie is about a young couple haunted by a supernatural presence in their home and it is presented in a documentary style, using footage from the camera set up by the couple to capture what is haunting them.
Despite garning some interest, no distributor picked it up until a copy of the film ended up at DreamWorks, where it was seen by production executive Ashley Brooks.
It went down so well with production chief Adam Goodman, studio head Stacey Snider and a certain Steven Spielberg, to the point where they greenlit a larger budget remake, with the original production to be included on the DVD as an extra.
However, the low budget nature of the original film was part of its allure and after screening it for international buyers in Santa Monica, the reaction was such that international rights were sold to 52 different countries.
With all this buzz Adam Goodman (who had since taken over as Paramount’s main exec) decided to release the original film in limited release during October.
It was during this period that the marketing department felt that they could use internet buzz to their advantage.
Another stroke of good luck was when Paramount decided to postpone the release of Martin Scorsese’s latest film Shutter Island from an October 2009 release to February next year.
Presumably this was because they either felt it wasn’t Oscar-friendly enough, or because their pipeline of films needed some big name action in the first quarter of next year.
In any event, it meant that “Paranormal Activity” had the full attention of Paramount’s marketing folk and especially that of online marketing executive Amy Powell who, along with her team, adopted an innovative online grass roots campaign.
Inverting the way which mainstream films are usually released in thousands of theatres with a heavy TV and outdoor marketing campaign, Powell and her team opted for a very different strategy.
Playing on the idea that the film was ‘really scary’ and something of a cult in the making they asked film fans to demand a screening in their area via sites like eventful.com
The towns who got the most votes would ‘win’ a booking of the film. Furthermore the studio said that if Paranormal Activity got over a million votes, they would release it nationwide.
What’s particularly ingenious about this unconventional approach is how it built an army of dedicated fans and paying customers very cheaply.
Instead of being a big, bad studio making crap like G.I. Joe, Paramount had effectively taken the side of the average movie fan, helping them see this unbelievably scary horror film.
Journalism students and media pundits might like to debate the following quote from the movie website Rope of Silicon:
I have obviously been shilling for Paramount’s Paranormal Activity more than I have for a movie in quite some time, but when you have a great time in the theater with a film you believe should only be experienced in the theater with a rowdy and on the edge of their seat audience you want others to get in on the fun.
I can’t quite see the New York Times of The Guardian openly admit they were ‘shilling’ for a movie but maybe it’s a sign of how the media landscape is changing in that outlets openly admit they’ve been co-opted into the selling of a film. But maybe that’s a debate for another day.
Although the studio felt that the initial buzz was limited to film geeks and fansites, they managed to break out from that particular ghetto, persuading people to use Twitter (“tweet your scream!“) and Facebook (112,653 fans so far) to get a million votes for the national release.
Demand it they certainly did. When they finally cracked the million (after just four days) the studio posted a message to the site saying “You did it!”. YOu could interpret this as also saying “gee, thanks for doing our marketing work for us – for free!”. User generated marketing anyone?
But of course, the official line was the more uplifting:
“The first-ever film release decided by you.”
Which in modern Hollywood terms wasn’t actually that far off the mark.
As Powell said recently:
“We have been able to galvanize the community online to actually drive the release strategy and the film has been released as a result of the fans support”
On October 9th it got a limited release in several U.S. cities and had a nationwide opening from last Friday (October 16th).
Notice how the trailer incorporates the marketing campaign:
This weekend the film went head to head with Saw VI (the hugely profitable horror franchise which has dominated the Halloween box office since 2004) and despite playing on a considerably lower number of screens (around a 1000 less in fact) it still managed to beat it – a truly remarkable feat for a film in its 5th week of release.
Saw VI will probably finish the weekend with a $15m gross compared to Paranormal Activity’s $21m. So far the latter has an overall gross (or cume to use industry speak) of $62m.
Again, incredible numbers for a micro-budget project that got promoted to the big league.
But it doesn’t just stop there, as the studio can now surf the buzz of being the number 1 movie and it will expand next week (Halloween weekend, appropriately enough) and some even think that it has a shot at grossing over $100M.
When you think that the film was made independently for $11,000, bought by Paramount for an estimated $300,000 and had around $10M spent on prints and advertising, the numbers add up to one of the most profitable films in recent Hollywood history.
The only comparison I can think of is The Blair Witch Project back in 1999. However, the fact that it took ten years for another low budget film to crash the mainstream suggests that they are rare beasts.
Or does it? Perhaps studios might be a little more keen to try out low budget films and more grass roots marketing via the web.
Of course you have to have the right kind of film, but if a few more releases like Paranormal Activity pop up over the next few years it may not be such a surprise.
Certainly rival studio execs and marketing departments will be looking at how this film became a hit and whether or not the marketing of it represents a future trend.
Paranormal Activity is released in the UK on November 25th
But there will be smiles and relief all around at Burbank this weekend as it seems likely to be a hit even though it was a costly and drawn out production, with the budget rumoured to be around $100 million.
On Friday it opened wide on 3,735 screens and Deadline is reporting a likely $33M weekend, whilst The Wrap thinks it could top $40 million.
I’m guessing that, like the book, it is going to be a perennial children’s favourite for years to come.
Slumdog Millionaire is still top of the UK box office despite a raft of high profile films opening last Friday.
A combination of awards season buzz, word of mouth and the fact that it is really good, helped it take £2.8 million over the weekend, which leaves its current UK gross at £10.2 million.
Given that its production budget was just $15, this is very good indeed. And all this despite a terrible UK poster.
Fantasy horror sequel Underworld: Rise of The Lycans opened at five, whilst Oscar contender Frost/Nixon came in at nine.
Best picture nominee Milk made its debut at 14 in limited release.
Here are the top 15 films at the UK box office:
Slumdog Millionaire(Pathe)£2,806,996/ £10,239,371
Valkyrie (Fox)£1,854,195/ £1,854,195
My Bloody Valentine(Lionsgate)£1,182,514 /£3,347,088
Twilight is the film adaptation of the novel by Stephenie Meyer that looks set to rule the US box office this weekend.
The book is an international bestseller which has been translated into over 20 languages worldwide and there are currently four ‘Twilight’ novels: Twilight (2005), New Moon (2006), Eclipse (2007) and Breaking Dawn (2008).
They have a combined sale of over 25 million copies, which helps to make this one of the most eagerly anticipated films of the year and the start of a lucrative franchise for Summit Entertainment.
It opens in the US tomorrow (and on the UK in December 19th) and pundits are already predicting that it will take a huge bite out of the box office competition.
… a phenomenon in industry tracking and advance sales, and two separate competing studio sources are telling me that they expect the film adaptation of Bella and Edward’s forbidden romance to top $60 million in its opening three days.
He has also writes that the film is skewing towards females:
Industry tracking indicates that Females Under 25 will make up the core audience for Twilight, but Females 25 Plus, including moms, have “Definite Interest” in seeing it.
It’s not entirely surprising, considering that there is even a website called TwilightMoms.com.
Interestingly, although there aren’[t many Males Under 25 who name Twilight as their “First Choice” in tracking data, an industry insider tells me that the “Definitely Not Interested” score with young males isn’t through the roof.
If Twilight is not especially objectionable to teenage guys, then they are more likely to be dragged to see it by girlfriends and dates this weekend.
Summit Entertainment will be running the pic in 3,386 theaters and has arranged with the major theater circuits for Thursday midnight or Friday morning shows.
As of noon ET today, Twilight has already sold out 389 performances at MovieTickets.com, including more than 140 this past weekend alone.
Four days prior to its release,Twilight is already No. 20 on MovieTickets’ Top-20 Pre-Sale List of All-Time. The pic has accounted for 85% of tickets sold on the site today.
The Twilight soundtrack is #1 (on Top 200, Soundtrack and Alternative charts) after one week of release. It’s the first soundtrack to accomplish this feat in 6 years (since 8 Mile was released).
All of which has taken Hollywood a bit by surprise. Although it was expected to do well, in recent weeks the buzz has reached fever pitch.
Whatever happens it looks like it will be a major hit, which will be impressive for a film with an estimated production budget of $37 million.
Plus, it will be the first major film for Summit Entertainment, which has had a series of box office duds since they got into production, acquisition and distribution.
The execs at MTV Films must be kicking themselves as they originally had the film rights but passed on the project before selling it to Summit.
Will it deliver the goods? I’m seeing it on Sunday so I’ll write some thoughts then.
Twilight opens in the US tomorrow and in the UK on December 19th
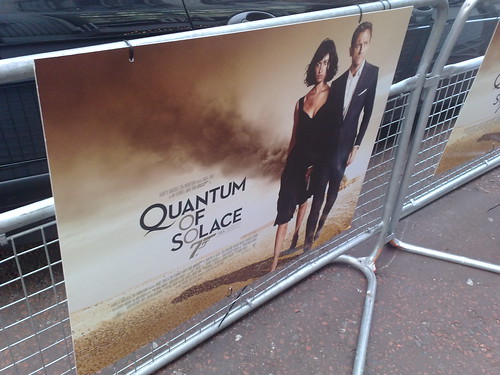
The latest Bond film Quantum of Solace has made box office history on its opening day in the UK, taking amassive £4.94m and making it the biggest Friday opening of all time.
The latest installment from the longest running franchise in film history, has also beaten the opening day figure for the last Bond movie, Casino Royale, which took £2.9m on its opening day.
The new film opened in 542 cinemas in the UK and Ireland on yesterday (Friday 31st October) and will open in the US on November 14th.
UPDATE: 03/11/08: The film has now earned a massive £15.4million over it’s first three days, making it the biggest weekend opening of all time at the UK box office.
This beats the previous weekend record held by Harry Potter and the Goblet of Fire, which took £14.93million.
According to Variety the new Bond film captured a ‘jaw-dropping 70% of the market’.
In only its 18th day in release, Warner Bros.’ “The Dark Knight” reached the $400 million mark in domestic sales on Monday, grossing $6.3 million for a cume of $400.1 million.
That easily beats the 43 days it took “Shrek 2” to jump the $400 million boundary.
Some pundits were predicting that The Mummy: Tomb of the Dragon Emperor would just beat out the Batman sequel this past weekend but the caped crusader grossed $42.7 million, narrowly ahead of The Mummy which took in $40.5 million.
In foreign territories it has taken over $200 million, which is pretty remarkable even for a summer blockbuster, especially as it has achieved this number in 18 days.
Unless there is an unexpected drop off, it will almost certainly end up in the top 5 grossing movies of all time but can it beat the all time champ Titanic?
Talk has turned to whether the bat has the chops to overtake Stars Wars’ $460.9m (£233.4m) lifetime tally to become the second biggest earner in history.
It could well do. Overhauling Titanic’s legendary $600.8m (£304.2m) mark is another kettle of fish, however.
Many believe it will never be bettered and I’m inclined to agree. Still, you never know, and I’ll gladly take my hat off to Nolan if it does.
By the close of Tuesday, after 15 days on release, The Dark Knight stood at $333.9m (£169m) in the US and Canada, making it the biggest film of the year-to-date in the US and Canada and the 16th biggest release in North American history.
It’s been averaging a little over $10m in daily tickets sales this week thanks to rabid word of mouth and nationwide school holidays.
By conservative estimates, factoring in a 50% drop-off in ticket sales in the third weekend, The Dark Knight should boost its cumulative gross by $35-40m (£17m-£20m) by the end of Sunday, which would catapult it into the lifetime earnings top 10 on a tally of more than $380m (£192m).
How much it drops off this weekend is contingent on the number of new and repeat visits and, of course, the competition.
The extraordinary thing about Titanic was that when it opened in the US in December 1997 it didn’t have the blast off that accompanies a lot of blockbusters.
It actually took 12 days to pass the $100 million mark and just kept grossing consistently as it stayed top of the box office for an unprecedented 15 weeks, which is still a record.
Strangely, it had it’s biggest weekend gross in mid-February as no doubt the Valentines Day effect kicked in. In short it is an anomaly amongst big grossing films and unlikely to be broken in the near future.
Directed by Guillermo de Toro (fresh from the success of Pan’s Labyrinth), it sees Ron Perlman reprise his role as the demon who fights for good, this time against an army of creatures unleashed from another world.
On Friday it took an estimated $12.75 million, which set it up nicely to overtake Hancock, last week’s Number 1 film.
The fact that Hellboy II made 50% more than the 2004 first movie’s $23.1M opening FSS is a real triumph for Universal Pictures, whose bosses Marc Shmuger, David Linde and Donna Langley swooped in and scooped up the sequel from Sony/Revolution Studios which did the original Hellboy I. (And the trio wanted it before del Toro’s Oscar-nominated Pan’s Labyrinth ever opened.)
As one Uni exec exulted, “We took somebody’s reject pile and made it into a franchise for us.”
Hancock held steady in second place with a 50% drop from last weekend, which is impressive given last week’s longer 5-day weekend and the mixed reviews it received.
As for the other new films this week, Journey to the Center of the Earth looks like it will nab third spot ahead of WALL•E, whilst the new Eddie Murphy comedy Meet Dave didn’t fare so well.
It looks like it will gross about $4.1 million over the weekend, which will be his weakest opening in years.
Here are the latest estimates for the weekend box office from Variety:
Hellboy II: The Golden Army (Universal) / $35.9m / Screens: 3,204
Hancock (Sony) / $33.0m / Screens: 3,965
Journey to the Center of the Earth (Warner Bros./New Line) / $20.6m / Screens: 2,811
WALL-E (Disney/Pixar) / $18.5 / Screens: 3,849
Wanted (Universal) / $11.6m / Screens: 3,157
Get Smart (Warner Bros.) / $11.1m / Screens: 3,086
Meet Dave (Fox/New Regency) / $5.3 / Screens: 3,011
Kung Fu Panda (Paramount/DreamWorks) / $4.3m / Screens: 2,704
Kit Kittredge: An American Girl (Picturehouse) / $2.3 / Screens: 1,849
Indiana Jones and the Kingdom of the Crystal Skull (Paramount) / $2.2 / Screens: 1,664
After the relatively disappointing performance of Hostel 2 in the summer, some were predicting that the recent cycle of horror films featuring torture had run its course.
With a highly impressive weekend total of $32.1 million it seems that is not the case, at least with the Saw franchise. I went to a screening in Central London at 5pm and was surprised at how many people were there.
It wasn’t full by any means but it was noticeable at how varied the audience was – it was fairly mixed between males and females of different ages.
For those who haven’t seen the films – or those who avoid them – they all revolve around a serial killer mastermind called Jigsaw. In each film he sets a series of traps (often involving diabolical devices) for his victims which allows them the opportunity to escape if they are prepared to sacrifice something, usually part of their body.
Saw was actually pretty good, two was OK, three poor and four just OK again. But can Saw V sustain what is a remarkably profitable franchise for Lionsgate? Although they are sadistic and gruesome, people clearly want to check them out. But why?
Is it a craving to see shady characters get tortured in ever more elaborate ways? Do people just enjoy the Se7en-like structure in each film which involves a serial killer leaving a riddle for the cops? My feeling is that it could be a little of both.
But what do you think makes them so successful with audiences?
Michael Clayton opened in the UK almost 2 weeks ago and in limited release in the US last Friday.
It’s done OK, but it really deserves to have performed better here, as it currently sits at Number 9 in the UK charts with a gross of £1,273,849. This despite great reviews and a big star in the lead.
I went to see it again on the opening weekend at the Cineworld Haymarket in London and was slightly alarmed at the empty seats. It seemed to go down well, but watching it again I realised how much of the film’s slow burning pleasures are more apparent on second viewing.
It isn’t an easy movie to digest in one go – the way it is constructed forces you to think not only about the events and characters on screen, but also about the issues and themes it raises. It is a little ‘difficult’, but in a way that is actually most welcome.
Maybe certain people will be put off by the title (a complaint I’ve heard a couple of times) or just put off by the idea of a dry legal drama. But make no mistake, this is really smart and absorbing cinema. The performances (especially George Clooney, Tom Wilkinson, Tilda Swinton and Sydney Pollack) are terrific and cinematography by Robert Elswit is especially striking in a way that isn’t obviously showy.
In some ways, it is the kind of film that some claim used to exist in the 70s but doesn’t anymore. Clooney himself made this point in a recent interview with The Times:
“I gave as a gift to my friends for Christmas last year 100 DVDs of my favourite films from 1964 to 1976. It was going to be 1965 to 1975, but that meant leaving out Strangelove and Fail-Safe. And Network and All the President’s Men and Taxi Driver and Bound for Glory. But you look at these films – you could find 10 films a year that are masterpieces. And the people who were making them were studios.”
Sadly there is some truth in that, as no mainstream studio wanted to fund it – even with a bona fide A-lister like Clooney in the lead role:
“They don’t make those films any more; you couldn’t come near making those films. This film was taken to a studio. They wouldn’t make it.”
Warner Bros are only distributing it in the States, with Pathe releasing it over here. However, it will be interesting to see how it does next week in the US when it expands from 15 to 2,400 screens.
In the meantime check out an interesting interview below where David Poland of The Hot Blog and MCN speaks to writer-director Tony Gilroy about the film:
Superspy Jason Bourne delivered more than an ultimatum this weekend as the third in a series of spy thrillers topped box office charts and delivered the biggest August opening of a film ever.
“The Bourne Ultimatum” took in $70.2 million this weekend, far surpassing the openings of both of the earlier Bourne films based on novels by Robert Ludlum.
The opening also pushed last week’s top film, “The Simpsons Movie,” to second place, with $25.6 million. The big-screen version of the animated TV show has topped $315 million worldwide for distributor Twentieth Century Fox.
“We’re really riding high today,” said Nikki Rocco, head of distribution for Universal Pictures, which put out “The Bourne Ultimatum.” “The reviews and audiences rated this one the best one yet.”
The second in the series, “The Bourne Supremacy,” earned $52.5 million in its opening weekend in 2004, while the first film, “The Bourne Identity,” had an opening weekend take of $27.1 million when it debuted in 2002.
The vast majority of the audience (94+%) had seen prior Bourne movies and 60% said that was the main reason for seeing the threequel.
It did more than twice the June 2002 original The Bourne Identity (which opened to $27 mil) and way more than the July 2004 sequel The Bourne Supremacy (which debuted to $53 mil).
Ratings of the movie broke down to 80% “Excellent/Very Good”, 40% “Excellent”, and 55% “Definitely Recommend”.
Another strong sign was this PG-13 pic’s per screen average Saturday, a healthy $6,950.
The only bad news is that I hear script tweaks and reshoots made the price of this Bourne creep upwards to $110 mil. But its domestic and international ticket receipts should hand Universal a hefty profit, nonetheless.
But despite the film’s success, director Michael Bay is not happy with two of the film’s producers, Don Murphy and Tom DeSanto. He feels that they have been taking too much credit for the film.
Wow that was a hard one, but I must tell you it was so much fun. The most difficult actors I’ve ever worked with, besides Bruce Willis, are Optimus Prime and Bumblebee. They took every single one of my days for a year. But they are well worth the work.
I’ve just traveled 36,000 miles around the world (in two weeks) and had the most amazing premiere at the Taormina film festival in an ancient, Greek-built theatre that existed well before the birth of Christ. I loved seeing the reactions to the film from so many different cultures. This movie really travels around the world. I’m so excited for everyone to see it. Thanks to all you that supported me on this film.
Just so I set the story straight, my budget started a $145 Million it crept to $150 and some change – I’m very proud of that – the fact that we are half the cost of all these other summer blockbusters. I see people doubt that out on the net, but anyone want to challenge me I’ll put a ten thousand dollar bet down on the table right now.
Even when the studio tried to ship me out to Canada or shoot down with Aussies – I looked but I knew we were dead up there. I needed my crew that I have been loyal to for years, they are the best in the world. Besides I believe American movies that portray America, should be made in America. I cut my fee 30% so I could make this at home.
I knew this was right for the movie so I asked the other producers to join – Ian and Lorenzo did, and the two others (that came attached to the project) Tom Desanto and Don Murphy did not. That was my introduction to them – they did not want any part of their fee going to make a better movie. Things like that don’t usually sit well with me.
Now that the movie is done I get strange questions from the press. Like “how did Tom control the set”? What? “ How did Tom and Don control you?” What the fuck. “How was it working with Tom and Don who knew Transformers so well?” “We heard Tom wrote the story – he had a 90 page treatment, right?” Okay stop. Let me take you back in time. Tom and Don are very nice guys, but let’s get some facts straight.
Tom had one creative meeting with me for one hour and ten minutes to be exact about a year ago. He told he was the über fan boy and was going to protect me from the minefields. The type of minefields on the Net like “Damn you Michael Bay” “You wrecked my childhood Michael Bay” and other various web death threats I received. Tom proceeded to tell me how much he had problems with the robot designs and script issues.
I realized he was worlds apart in my vision. I said thank you very much, and then showed him my office door – I never really spoke to him again other then to mutter hello. He would occasionally come to the set with guests like it was some theme park. I never spoke creatively with Don. I read his notes kind of trashing the script and making me and the writers feel like a big shit pile. But during production Don was nice to me, he knew I was not going to talk creative with him.
One day not too long ago, the writers of our movie Alex and Bob called me in a panic saying all of a sudden after the movie was almost finished in post that Tom was applying for writer’s or story credit. I was appalled because neither the writer’s nor I ever saw any treatment. Well, he applied for credit, but the Writer’s Guild shot him down, denied him.
But what made my blood curl was something that was on the Net with Tom at the Saturn awards on IESB.net where they interviewed him about the movie – a movie I might add he had not seen yet. He acted very much like he did. Check it out as he vamps through the questions, and how Hugo put his “thumb print on it”. Give me a break the guy was lying through his teeth – he had seen nada, nothing until the press screening.
So that’s the real truth, I had to say it, cause I’m tired of answering these questions.
What these guys did do was stuck with a ‘silly toy movie’ and pushed it around town and kept the faith after everyone turned them down, always with the hope that maybe someone somewhere would make it. Now I commend them on that.
Hats off to them, but trying to taking creative credit in the press let me just say it – irks me. Too many credits are given to too many people who had nothing to do with the movie. Hell even investment bankers with not the slightest idea of how to make a movie all of a sudden are big producers in town.
I think you all know by now I don’t really have an ego. I got paid well for doing the film. It was my job. LOTS of other people played an important part in the film, some waaay more than me. Steven maybe didn’t have the idea to do the film but without him it never would have happened.
A cat named Adam Goodman at Dreamworks who you probably never heard of put his head on the line and made the film happen. If not it never would have been made. Alex and Roberto as I said above. John Rogers early on. An exec still at Dreamworks, great guy, Marc Haimes, and a DW exec who just left, John Fox were crucial in making it happen time and again.
A woman no longer at Hasbro, Carol Monroe started the ball rolling. And Brian Goldner, the CEO who trusted us all, while watching over us all, made it happen more than most people realize. And his team in Rhode Island. Desanto was by my side and fought the good fight often better than I did. HE’s actually more of a fan that I am.
Ian Bryce- I mean without him and his assistant Michelle this film never gets finished on time or even close to budget and it did both. And for all of you haters, this film is Michael Bay’s above and beyond every one else. He made every decision. I watched as he sometimes set up shots, blocked the scenes and operated the camera. His work ethic was stronger than any other director I’ve seen.
I think maybe he has been SO successful so young for so long people like to hate him. But when you see that movie and LOVE IT like I know you will, there is a reason it says A MICHAEL BAY FILM and not a Don Murphy or Pavel Lujardo Film. This guy made it all work. At no point do I or anyone deserve special thanks or special credit. It was a LOT of people, including the whole cast and the film crew, as well as Paramount which is marketing it super well.
I’m just not gonna let anybody rewrite history either no matter how hard they try.
While DeSanto and Murphy acquired the movie rights from Hasbro and shopped them, once DreamWorks and Paramount got involved, they placed studio producer Lorenzo DiBonaventura in charge of the movie for Paramount and production exec Adam Goodman for DreamWorks.
DeSanto and Murphy had little to do but handle some marketing and PR chores and deal directly with the fans. Two people, Steven Spielberg and Michael Bay, ran this movie. Thanks to DreamWorks, the script is better than Bay’s other pictures, and with a summer blockbuster to his credit, Bay wants to take full responsibility for repairing his reputation post-The Island.
The post by Bay was probably taken down so it wouldn’t distract from the film’s great opening week at the box office. But such a lengthy diatribe about the production can hardly be dismissed as a late night rant written in haste.
Anyway, isn’t there something refreshing about key players venting and giving their thoughts directly via their websites?
Imagine a Hollywood where directors, producers, studio execs and actors all blog about their hopes, dreams and problems.
It might even be as entertaining as the movies they make.
“Spider-Man 3” swung into theaters over the weekend with $148 million in ticket sales, according to estimates, shattering records for biggest opening weekend ever at the North American B.O., as well as biggest opening day on Friday.
Third in the Spidey series easily surpassed the previous record holder for biggest first day and weekend, Disney’s “Pirates of the Caribbean:
Dead Man’s Chest,” which raked in $55.8 million in a single day when it bowed last July for a three-day tally of $135.6 million.
Opening-day for “Spider-Man 3” on Friday was a whopping $59 million domestically.
Pic was the biggest worldwide weekend ever as well, with $375 million overall.
Hollywood’s biggest superhero now has the biggest box-office debut. “Spider-Man 3” took in a record $59 million domestically on opening day Friday, breaking the previous all-time high of $55.8 million for “Pirates of the Caribbean: Dead Man’s Chest” in its first day last summer.
Sony Pictures, the studio behind the “Spider-Man” franchise, also reported Saturday that the movie took in an additional $45 million overseas on Friday for a worldwide total of $104 million, a record for single-day grosses globally.
Sony spokesman Steve Elzer said executives at the studio declined to comment until estimates for the full weekend are available Sunday morning.
By then, the “Spider-Man” franchise could reclaim the record for best three-day opening ever. The first “Spider-Man” pulled in $114.8 million domestically in its debut weekend in 2002, a record that stood until “Dead Man’s Chest” shattered it with $135.6 million last July.
In a news release, Sony said it expects “Spider-Man 3” will come in around the $135 million to $145 million range for its first weekend.
Did you see it this weekend? And if so, what did you think?
The third and possibly final installment of the widely popular “Spider-Man” films made its world debut in Tokyo Monday in a rare move for Hollywood as it sees more opportunities overseas. Tobey Maguire, Kirsten Dunst and other stars of the movie attended the gala red-carpet premiere of “Spider-Man 3,” the latest chapter in the adventures of the web-spinning comic hero.
The potential summer blockbuster opens in Japan and other major Asian markets on May 1, three days before the United States. It will also come out on May 1 in some European countries including France and Germany. It marks the first time that Sony Pictures, despite its Japanese parent company, has chosen to debut such a high-profile film in Japan, the world’s second-largest box office.
“Of course, we are looking to boost our proceeds in Japan,” said a Sony official in Tokyo. Last year domestic fare overtook Hollywood movies in revenue at the Japanese box office for the first time in 20 years thanks to a growing crop of high-quality Japanese productions.
Analysts said Sony’s decision to launch the new “Spider-Man” in Japan was primarily symbolic as it will be out within days elsewhere in the world and can be expected to be a hit in the United States.
I think the the success of this film is pretty much assured. The question is really how big it is going to be. Given that spring releases like 300 and Blades of Glory have surpassed expectations to become major hits, the opening numbers for Spidey could be huge.
The first one was a faithful and well crafted comic book adaptation and was the biggest film of 2002. The second film was better – I think it still stands up as one of the best comic book adaptations ever put on screen – and this one looks like it could follow suit.
I’m seeing it this week so I’ll report back with some thoughts soon.
It tracks films to see if their rank has gone up on the various charts at athr site. You can select two views: Changes by Chart (which lists all the charts each movie moved on) and Changes by Movie (which lists all the movies that moved on each chart). It is handy to see how certain films are doing.
For example, it is interesting (or worrying depending on your viewpoint) to see that Night at the Museum is the 41st highest grossing film of all time at the worldwide box office.
The ancient battle of Thermopylae was the stuff of 2007’s first certified blockbuster as the bloody action tale “300” debuted with ticket sales of $70 million over its opening weekend, according to studio estimates Sunday.
That’s about $233,000 for every one of the legendary 300 Spartan soldiers who fought off a much larger Persian force in the epic battle.
“On a Spartan-by-Spartan basis, that’s a lot of money,” said Paul Dergarabedian, president of box-office tracker Media By Numbers. “Summer came a little early, because this is a summer-style opening.”
The number of movie-goers for the Warner Bros. epic “300” outnumbered crowds for the rest of the top-10 movies combined. If the estimate holds when final numbers are released Monday, “300” would break the record for best March debut ever, topping the $68 million haul for “Ice Age: The Meltdown” last year.
“300” played in 3,103 theaters, about 850 fewer than the “Ice Age” sequel, making its box-office performance even more notable. It averaged $22,567 a theater, a whopping number for a wide release.
There will be high fives all around the offices at Warner Bros. Not only is it a much bigger hit than they dared to hope for but given the relatively low production costs (compared to recent big budget films like Superman Returns and Poseidon) it could turn out to be one of the most profitable films in their history.
I’m seeing it again tonight and I’ll post some thoughts later but if you’ve seen it already then feel free to post what you think of the film in the comments section below.
I’m told Warner Bros.’ much-buzzed 300 about the epic Battle of Thermopylae (even though most of target audience fell asleep in school during that history lesson) looks set to shatter the record for biggest March opening ever.
This “Gladiator Lite” raked in $27.4 million Friday night for what is likely to be a $60+ million weekend in its 3,103 theaters. (I said back on Tuesday that 300 was tracking huge…) The studio mega-marketing this CGI extravaganza organized some sell-out Thursday midnight sneaks, likely $3.5 mil worth.
All 57 IMAX theaters that showed 300 at 12:01 a.m. also sold out. Given that this gory movie from the creator of Sin City was cheap to make and shot in only 60 days and cast with no stars, it could end up one of Warner’s most profitable pics.
Most pundits weren’t quite expecting this but given the buzz about the film and the lack of direct heavyweight competition maybe people shouldn’t be so surprised.
The ultra-bloody warrior film “300,” about a legendary battle between the Spartans and Persians, seemed headed for U.S. box-office glory on Friday with sell-out crowds flocking to early showings.
Imax, the giant-screen movie chain, reported that all 57 of its 12:01 a.m. Friday screenings of the Warner Bros. film had sold out as its advance ticket sales for the weekend hit a new record for the month of March.
“We had the most amazing night,” said Greg Foster, chairman and president of Imax Filmed Entertainment, adding that many Imax theaters arranged 2:30 a.m. shows at the last minute to accommodate fans who failed to get into the midnight showings.
Many of the rest of the nation’s 600 theaters with early morning shows also played to capacity crowds, said Dan Fellman, domestic distribution president for the Time Warner Inc.-owned studio.
“They were flocking everywhere, not just to Imax,” he told Reuters.
While overnight business accounted for a fraction of the more than 3,100 North American theaters where “300” was opening on Friday, the early surge at the multiplex was a strong indicator that the film was poised for a robust first weekend.
Some box-office analysts predicted “300” could finish the weekend in the $50 million range, an impressive achievement for a March opening given the film’s “R” rating and lack of stars.
A friend of mine in New York just sent me an IM saying he is going to see it. I have a feeling it could be in for a massive opening weekend.
Hot Fuzz, the police-procedural-thriller-action-comedy from the team behind Shaun of the Dead, shot to the top of the British box office at the weekend.
With a lineup featuring the cream of British comedy – Bill Bailey, Bill Nighy and Martin Freeman among others – alongside heavyweight thesps such as Billie Whitelaw and Timothy Dalton having a ball, the story of an overachieving police officer in a sleepy crime-free village laughed all the way to the bank. It raked in an opening haul of £5.9m.
Some people I know who’d seen it were a little disappointed – the common refrain seemed to be that it wasn’t as good as Shaun of the Dead. Much as I like that 2004 zombie spoof, I do think the Fuzz is better – more gags, more ambition and a little more verve.
Satan’s bounty hunter has looted the wallets of movie-goers. “Ghost Rider,” Sony’s comic-book adaptation starring Nicolas Cage as a motorcycle stunt driver moonlighting as a collector of evil souls for the devil, debuted as the top weekend movie with $44.5 million, according to studio estimates Sunday.
Mel Gibson’s latest epic “Apocalypto” was tops at the domestic B.O. over the latest frame, taking in $14.2 million off 2,465 engagements for a per screen average of $5,747.
At No. 2 was Sony’s “The Holiday” from romantic comedy maestro Nancy Meyers, taking in $13.5 million from 2,610 playdates for a per screen average of $5,172.
Pic played to 65% female auds.
In other new openers, Warner Bros.’ political adventure “Blood Diamond” bowed in 1,910 engagements for a take of $8.5 million.
After his drunken anti-Semitic outburst back in July, things did not look good for Apocalypto (a foreign language epic about the decline of the Maya civilization). However, positive reviews, the extreme violence in it and the controversy over his last film (The Passion of the Christ) clearly created a buzz around the film.
After seeing it earlier this week I can report that parts of Apocalypto are exciting and riveting. After a slow beginning it turns into an pulsating chase movie set amidst the backdrop of a violent society.
It is also a highly unusual mainstream release. Not only are parts of it extremely violent, but it is about such an uncommercial subject that Gibson essentially paid for the film himself.
Whilst it may not be quite as accomplished as its early admirers might have you believe, there is something heartening to see it beat and a soggy – and highly commercial – mess like The Holiday.
Despite being pipped by the penguins of Happy Feet at the US box office, Casino Royale is still doing the business in every other country in the world.
007 so far is doing Da Vinci Code-like biz in all 50 countries where it’s opened No. 1 (except the U.S. where it opened No. 2). There were 18 new international debuts for Casino Royale this week – all #1, including France, Germany, Spain and Scandinavia. So far, that’s an overseas total of $66.2 mil from this weekend’s haul — the 6th biggest international weekend of 2006.
Last week, the spy pic was #1 in all 27 countries where it opened, earning $42.2 mil from the UK, Russia, India and small territories in the Mideast and Asia. (Last week, it scored the #9 all-time UK opening, and the biggest Bond opening ever in the UK by 46%.)
Right before the debut weekend, Sony Pictures was lowering expectations for Casino Royale in the U.S. and counting more on foreign sales. The studio was right: the pic now looks like the biggest Bond ever worldwide, moving up from $82.8 mil last weekend to easily passing $224.5 mil this weekend (including the $128.2 mil foreign and $94.2 mil U.S. cume) with many major foreign territories still to go, including Japan, Korea, Italy and Australia.
Meanwhile Box Office Mojo says that even in the US it is holding strong at Number 2:
Down 24 percent, Casino Royale was as impressive as Happy Feet, holding better than James Bond’s previous Thanksgiving titles, GoldenEye, The World Is Not Enough and Die Another Day, which each fell over 31 percent on this weekend. Casino Royale captured an estimated $31 million and, with $94.2 million in 10 days, has sold nine percent more tickets than GoldenEye, the last Bond reboot, through the same point.
Happy Feet just wins the battle against Casino Royale at the US box office according to Variety:
A cadre of singing and dancing penguins beat out the monkey-suited international superspy James Bond at the B.O. this weekend, as Warner Bros. and Village Roadshow’s CG-animated “Happy Feet” skipped to No. 1 with $42.3 million thanks to a particularly strong Saturday run.
Meanwhile the trade paper also reports that Casino Royale is doing very good business around the world:
James Bond returned with a bang at the international box office as “Casino Royale” dominated the weekend with $42.2 million at 3,063 playdates in 27 markets.
“Casino” hit the jackpot in its U.K. launch with $25.6 million at 988, including $3.7 million in previews. Its Friday-Sunday take tied “Pirates of the Caribbean: Dead Man’s Chest” as the second-highest weekend launch in Brit history, trailing only “Harry Potter and the Goblet of Fire.”
With Daniel Craig in his first turn as Bond, the Blighty opening handily topped the previous Bond pic, “Die Another Day,” by 46%.
“Casino Royale” took in more than the combined foreign grosses of the next four pics — “Borat,” “The Devil Wears Prada” and “Open Season.” Combined with its second-place domestic take, “Casino” totaled $82.8 million worldwide for the weekend.


 It was during this period that the marketing department felt that they could use internet buzz to their advantage.


 and Edward (Robert Pattinson) in Twilight")